 本章对于机器学习在自动驾驶及ADAS方面的一些应用和实践做了初步介绍。
13. ADAS&自动驾驶
13.1 Openpilot
13.1.1 项目简介
Comma.ai是由天才黑客George Hotz(第一个破解iPhone、PS 3的人,相关介绍:https://www.bloomberg.com/features/2015-george-hotz-self-driving-car/) 创立的专注自动驾驶的公司,目标是1000刀实现自动驾驶,但公司由于受到美国国家公路交通安全管理局的严格管制,于是“一怒之下”的把整个系统开源,取名openpilot,从功能上完全具备了目前特斯拉的autopilot具有的能力,主要表现在ACC和LKAS上。目前为止所有自动驾驶汽车都属于level 2,包括Waymo、Cruise、comma.ai、Ford、Tesla,特点是需要驾驶员坐在驾驶位且持续关注行车状态并随时接管汽车,实验室车辆在我看来也就Leve 2+,Level 3阶段,在特定路段驾驶员可以完全不用关注汽车行驶状态,目前没有厂商实现L3。openpilot目前主要能力是在6min内无需人的干预(但人需要盯着)控制本田和讴歌某几款车的加速、刹车、转向,从效果看,是我个人目前最看好的开源项目,且与我之前的构想一致:无需对汽车进行改造,无需昂贵的硬件设备,即插即用实现自动辅助驾驶。另外消费者不一定买同一品牌汽车,他们的数据也可以互相共享,从而降低自动驾驶造成的事故发生几率。
13.1.2 基本概念
1、CAN CAN总线:(Controller Area Network, CAN)即控制器局域网络,是由以研发和生产汽车电子产品著称的德国BOSCH公司开发的,并最终成为国际标准(ISO 11898),是国际上应用最广泛的现场总线之一。不仅用于汽车,也广泛运用于工业,商业等领域。 在汽车领域,CAN是用于连接电子控制单元[ECU]的多主串行总线标准(通讯总线)。CAN网络需要两个或多个节点进行通信。节点的复杂性可以从简单的I / O设备到具有CAN接口和复杂软件的嵌入式计算机。节点还可以是允许标准计算机通过USB或以太网端口与CAN网络上的设备进行通信的网关。所有节点通过两线总线相互连接。电线为120Ω额定双绞线。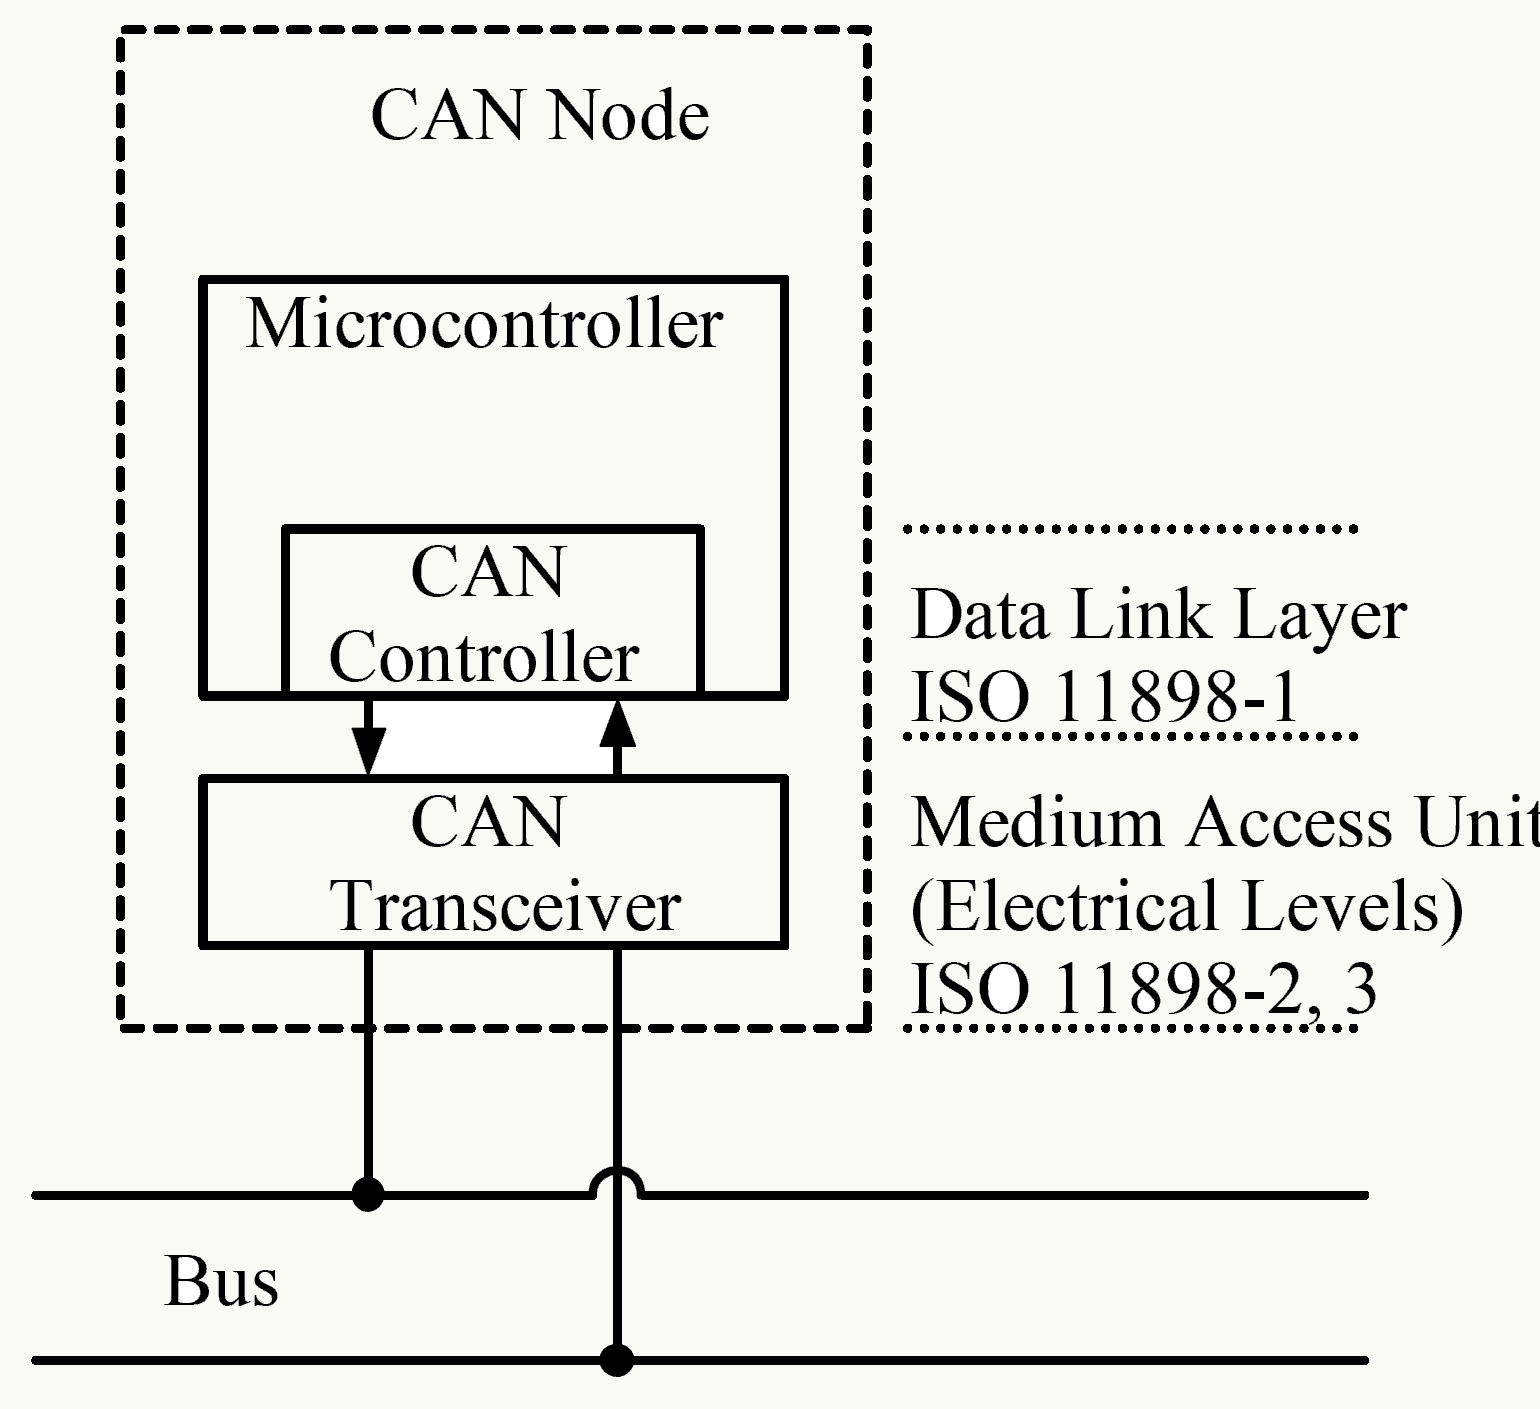
2、LIN LIN总线:(Local Interconnect Network)本地互联网,是一种低成本的串行通讯网络,用于实现汽车中的分布式电子系统控制。LIN 的目标是为现有汽车网络(例如CAN 总线)提供辅助功能,因此LIN总线是一种辅助的总线网络。在不需要CAN 总线的带宽和多功能的场合,比如智能传感器和制动装置之间的通讯使用LIN 总线可大大节省成本。 在汽车电控系统中,数据交换主要经由CAN总线完成,LIN总线是其补充与完善,不仅仅是出于成本的考量,更是(当今通讯技术发展条件下)充分保证高速数据交互效率的完美结合。 3、NEO 一个开源机器人软件开发平台,目前和 Neo 适配的智能手机只有中国厂商一加生产的一加 3 手机,只有这部手机权限足够开放,而且相机和芯片 (高通骁龙820)都符合要求,且会利用该手机的GPS。硬件成本700刀。 4、panda 通用汽车接口软件,用来控制与CAN和LIN的通信。
13.1.3 系统架构
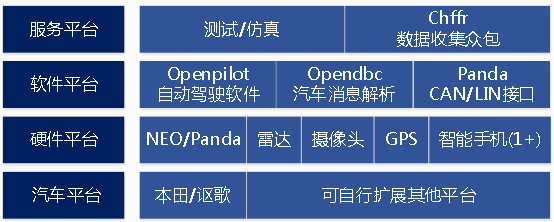
汽车平台 目前只支持本田旗下几款车(且它们并没有公司间合作): Acura ILX 2016 with AcuraWatch Plus、Honda Civic 2016 with Honda Sensing、Honda CR-V Touring 2015-2016这几款车型。通过几个接口可以扩展到其他车型,https://comma.ai/bounties.html 为鼓励计划,目前看汽车本身无需安装其他硬件设备。
硬件平台
1、NEO/Panda用于支持CAN/LIN通信,前者是一个机器人软件开发平台,后者是与汽车通信接口软硬件,平台开源可以方便支持OpenXC 、 Kvaser、 CANBus Triple。目前在本田上的所有通信实现只依赖2个CAN总线,1个车辆CAN、1个雷达CAN。
![]()
2、雷达 使用车载雷达即可,无需安装其他雷达
3、摄像头、GPS、智能手机 没有使用独立的摄像头和GPS模块,而是通过一部智能手机支持,目前全球能够支持的只有一加3手机,因为其权限足够开放,配备骁龙820、6GB RAM、以及光学+电子防抖,但目前看能够承担的运算不能太复杂,例如:车道检测和车辆识别的inference部分,车道线合并等。 相关视频: https://www.youtube.com/watch?v=3lIc3WnAxw8 https://www.youtube.com/watch?v=64Wvt5pYQmE&feature=youtu.be https://www.youtube.com/watch?v=EQJZvVeihZk
软件平台
1、openpilot 框架比较清晰的软件架构,后面介绍
2、opendbc 依据车型订制的CAN通信消息封装接口
3、panda 与panda硬件配合的用于和汽车CAN/LIN通信的接口,关于它的详细说明:https://medium.com/@comma_ai/a-panda-and-a-cabana-how-to-get-started-car-hacking-with-comma-ai-b5e46fae8646
服务平台
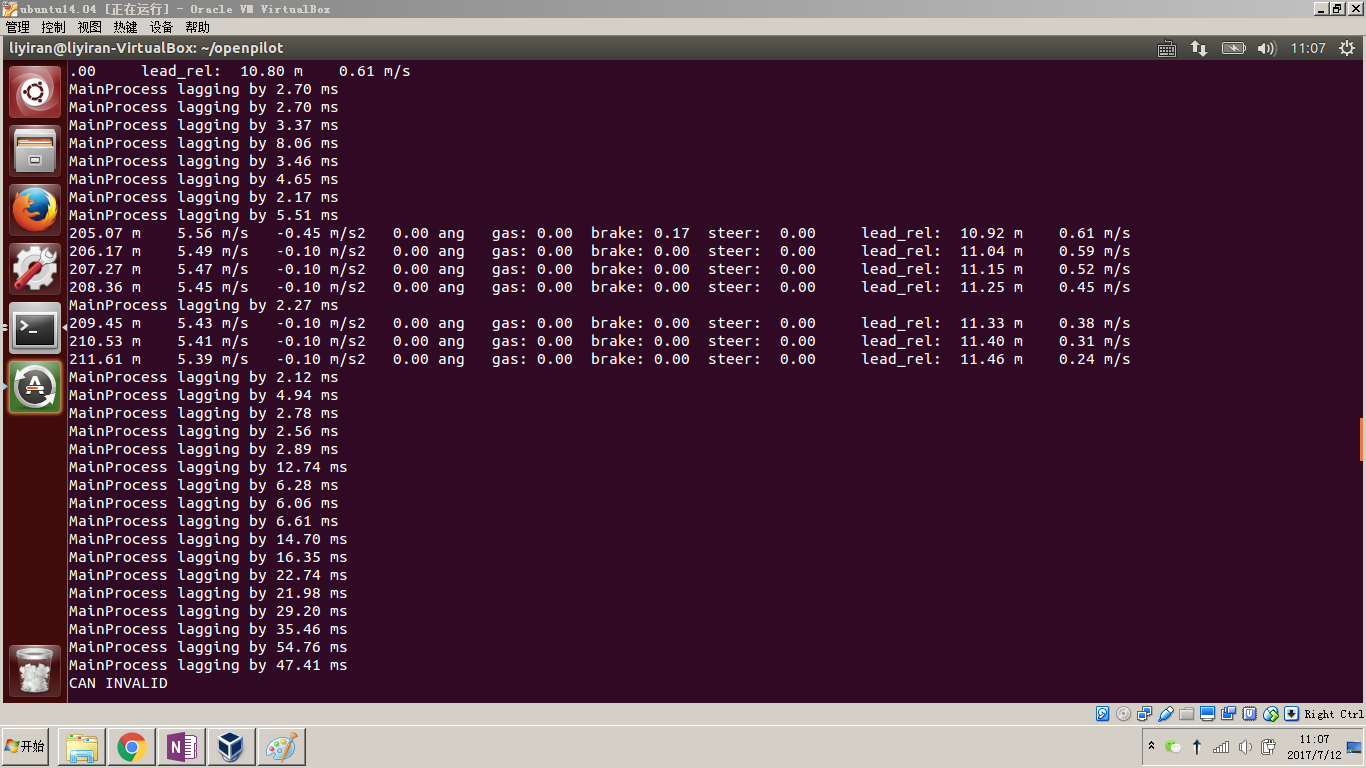
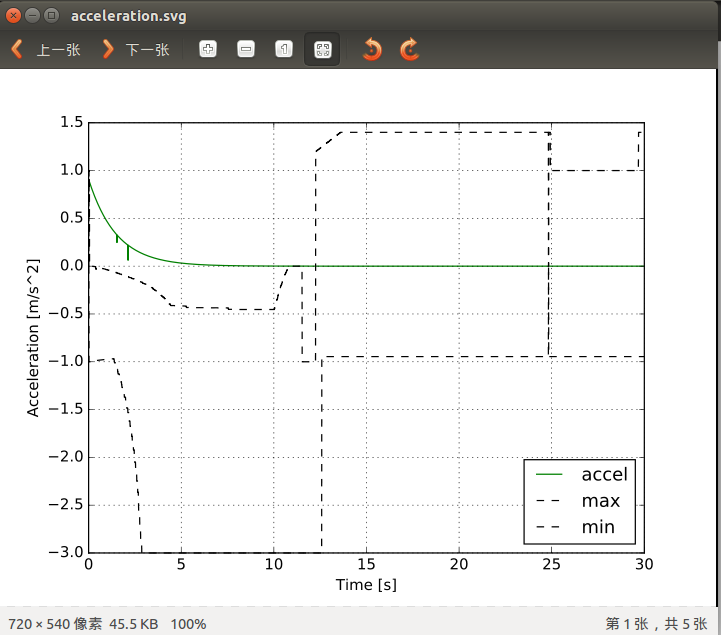
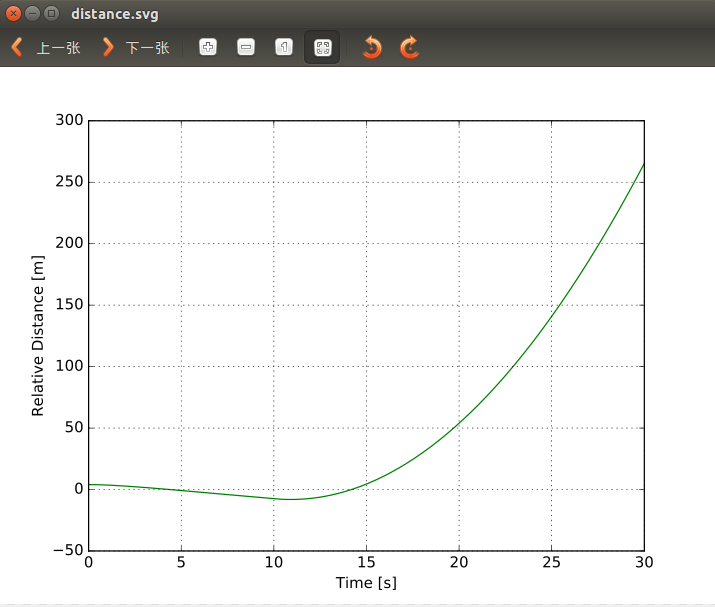
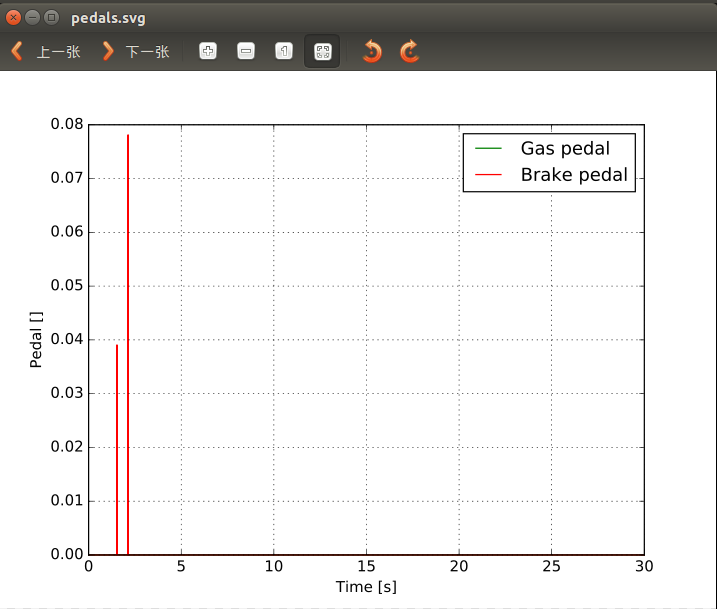
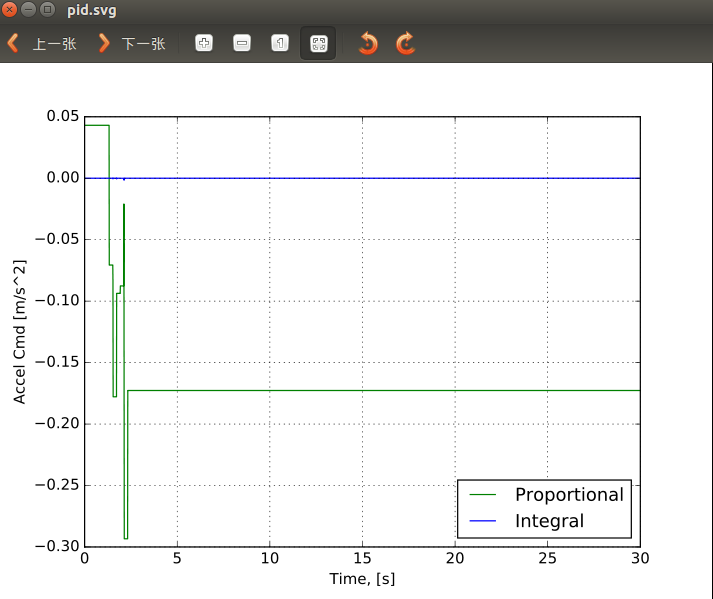
1、仿真平台 仿真对于自动驾驶来说至关重要,openpilot目前无UI界面,通过后端跑仿真测试样例,并将结果绘图方式展示:
![]()
加速仿真:
![]()
距离仿真:
![]()
踏板仿真:
![]()
加速度仿真:
![]()
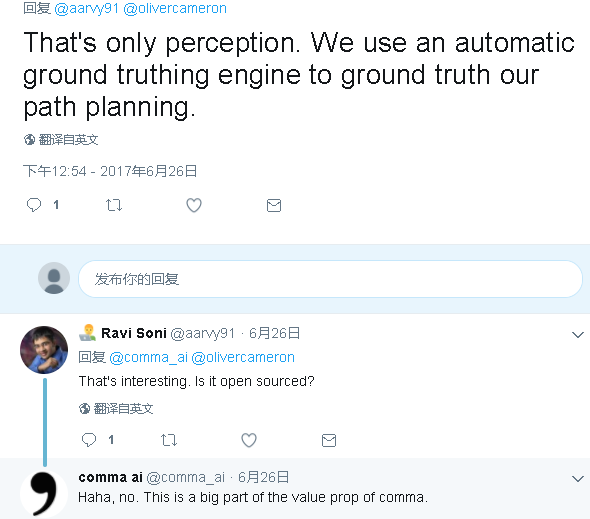
2、chffr 众包的数据收集app应用,目前有 1,000,000 miles的用户上传数据,通过积分、现金鼓励的方式运营,性价比比较高,另外还有一个比较牛的东西是automatic ground truthing engine(未开源),可以自动把chffr上的数据或任意视频数据做自动gt标注。
![]()
不过大体做法也许可以参考下面论文,基本思路还是利用语义分割做: http://www.es.ele.tue.nl/~sander/publications/icip14.pdf http://vladlen.info/papers/playing-for-data.pdf ps:常规的思路是例如https://commacoloring.herokuapp.com/ 这样的人工标注平台,不过光它产生的这些数据就值不少钱。
13.1.4 软件架构

代码层面,由c/c++和python完成。
13.1.5 汽车基础组建
1、Panda 一个独立的开源项目,与panda硬件配合,是汽车通信的硬件接口,支持手机/pc与汽车的CAN/LIN通信,整个硬件仅需要88刀。
2、Opendbc 封装标准的CAN通信消息,依据车型订制,消息结构为:
identifier +11-bit标准段+29-bit扩展段,整个消息长度可扩展到8 bytes。
1 | BO_ 228 STEERING_CONTROL: 5 ADAS |
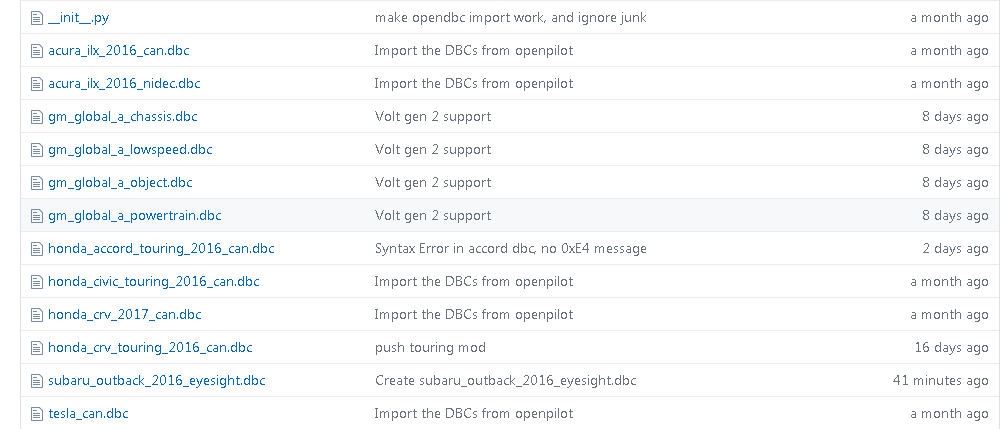
Dbc文件抽象及其格式解析的通用代码分别在: https://github.com/commaai/openpilot/blob/v0.3.2/common/dbc.py https://github.com/commaai/openpilot/blob/v0.3.2/selfdrive/car/honda/can_parser.py
13.1.6 公共组件
这里封装公用库函数,例如:卡尔曼滤波器、dbc文件管理、异常管理、车系管理、计算加速、参数封装、实时时间读写封装等,全为python代码。
13.1.7 手机组件
智能手机是openpilot的最大硬件,所有通信、数据收集、计算、展现都是通过手机作为载体。整个openpilot采用cap’n proto做消息序列化封装,使用ZMQ做消息通信,很高效,整体架构提前做了ROS 2.0想做的事。 can’n proto(https://capnproto.org/)的效率更加适用于这种嵌入式场景: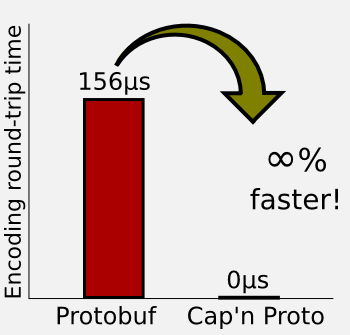
ZMQ(ZeroMQ,http://zeromq.org/)是跨平台、高效的分布式消息队列,同样很适用于嵌入式场景。
cereal 封装所有用于手机端日志记录的消息接口,由两部分组成: log.capnp,封装了手机日志记录相关接口; car.capnp,车相关抽象层,核心是CarStateCarControl接口,如果想新加一种车,需要实现这个。
phonelibs 封装手机相关库,纯基于c的,有些库只有so。
13.1.8 自动驾驶组件
自适应巡航使用传统方法,这里不讲,主要讲车道辅助驾驶部分,整体结构如下: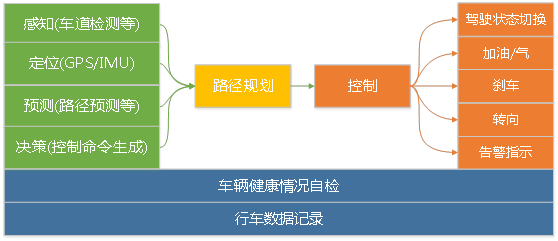
感知 在openpilot中感知主要是车道检测和传感器数据处理,前者使用的是一个深度神经网路,但网络结构没有开源,API开源,所以允许你定义模型:
1
2
3
4
5
6
7struct ModelData {
frameId @0 :UInt32;
path @1 :路径数据;
leftLane @2 :左行车道;
rightLane @3 :右行车道;
lead @4 :前方引领车辆;
...定位 未看到实现
预测 在openpilot中预测主要是路径预测,先预测前方某个长度路径是直的还是弯的,然后将这些局部路径合成一个长路径。
决策 依据当前车道信息、前车距离信息、自动驾驶时长信息做控制命令生成。
路径规划 一个独立进程,并没有做什么规划动作,主要是根据预测阶段产生的路径及决策信息决定后续路径。
控制 依据前面的信息产生后续动作并通过CAN/LIN接口执行消息发送以控制汽车姿态。 代码中:
○ 底层支持层
Assets用于UI字体支持; Common为封装的公共组件函数; Logcatd为独立进程,做Android日志管理,基于zmq和cap’nproto做消息通信; Proclogd为独立进程,做进程日志管理,基于zmq和cap’nproto做消息通信.
○ 对外交互层
Boardd为独立进程,用于车、机USB消息交换; Sensord为GPS/IMU接口代码,但未开源; Visiond为车道检测算法,前面有讲;
○ 行为执行层
Loggerd用于记录车辆行驶过程中的数据,用于后续模型训练; Car为封装的汽车抽象层前面有介绍; Controls为控制单元,是这一层的核心,包括了自适应巡航、距离控制、路径规划等; Radar为交互接口。
○ 前端表现层
UI用于绘制前端显示的行车线、车辆检测框、校准线等; Debug用于调试; Test/plant为相对简单的仿真后台。
13.1.9 总结
总的来说,自动驾驶最终解决方案一定不是不计成本的硬件投入,而是基于普通摄像头和车载雷达的低成本高性能解决方案。 所以我认为自动驾驶的技术核心是:
1、工程架构能力:如何满足可扩展性、高性能等要求;
2、核心模块的算法能力:主要是基于深度学习,需要tradeoff性能与效果,在嵌入式环境哪怕1ms都需要争取;
3、数据能力:两方面,收集数据的能力和数据标注的能力;
4、仿真能力:决定模型效果迭代能走多快。
目前开源软件能让我们达到Level 2,但要实现更高级别必须解决上面4个问题。
百度的apollo工程架构上设计比较合理,各子系统松耦合,但是目前整个项目是个空壳子,没有相关算法支撑,仿真系统也很粗糙,另外需要车载电脑等硬件支持,在通信性能方面我也有疑虑。 Openpilot在工程架构上比较合理,在资源消耗上比较小,硬件需求不强,我认为思路是未来的发展方向之一,缺点是没有大公司支持,属于个人英雄主义,且很多东西未开源。
整体来说开源自动驾驶技术方面大家都不完善,而自动驾驶的场景很重要,只研究技术是不够的,在我看来未来围绕着它有三大角色:
1、平台
2、主机厂
3、运营商
虽然趋势是合作共赢,但未来大家在这方面人才上的竞争会愈发激烈。
13.2 基于视觉的车道检测
13.2.1 传统车道检测方法
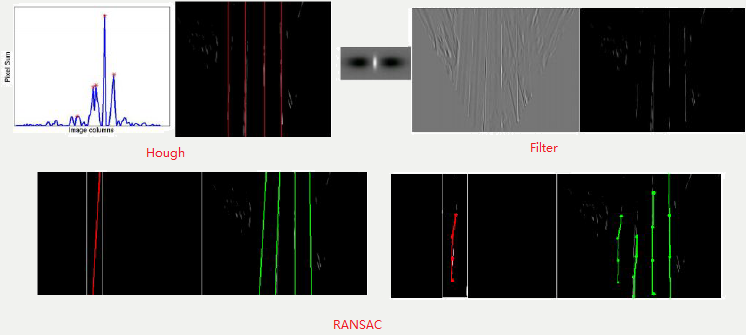
车道检测(LD)是ADAS/自动驾驶领域中的一个基本问题,可以基于激光雷达、视觉或者多传感器融合去做。但总的来说车道检测是个比较难的问题,原因在于:车道线和道路的多样化,例如:高速路、城乡结合部、土路、不同地区、不同国家对车道线的标准不同等;道路干扰因素较多,比如:树荫、遮挡、强光反射等;恶劣的视觉环境,比如:雨、雪、雾天气等。 其中,基于视觉的方法分为传统方法和深度学习方法。 传统方法一般需要做以下工作:
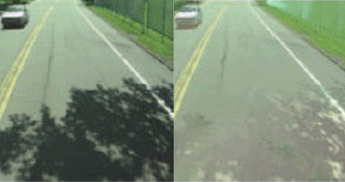
图像预处理 图像去噪;删除图像中不相关部分,如车辆、行人、障碍物;对图像中过暗或过亮部分做归一化修正;去除图像中阴影(如:树荫);根据摄像头位置提取图像ROI;图像边缘检测;腐蚀膨胀等。
![]()
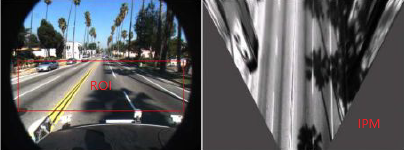
特征提取 通过人工方法直接在原图或通过原图生成的鸟瞰图提取亮度峰值、HOG、道路纹理、道路分割、车道曲率等特征。
![]()
模型拟合 模型需要做先验假设,可以采用参数学习(典型的像直线、曲线)、半参数学习、非参学习,然后采用合适的损失函数(如Square Loss)做优化求解。典型的传统算法如Hough变换,其本质是对图像进行坐标变换,让变换结果易于检测和识别;当车道线不清晰或存在其他干扰的情况下,传统方法会利用类似Gabor滤波做消失点预测(Vanishing Point:三维空间中的两条平行线在二维空间中的交叉点,简单说就是两个车道线的交点位置),然后利用消失点做车道线预测。也可以用卡尔曼滤波利用前几帧预测下一帧车道线位置。总的来说传统方法的天花板比较明显。
![]()
上下文信息集成 利用前几帧的信息提高下一帧的预测准确度以及复用前几帧的特征减少计算量。
图像后处理 对车道线之类的做其他处理使其能在真实世界中表示出来。
13.2.2 深度学习套路
基本上,深度学习的方法出来后大家套路日趋一致:
1、人工或半人工标注数据集(理论上越多样化、越多越好),改进对小物体的标注
2、数据预处理,例如做IPM;
3、选择一个基础网络做自动特征提取;
4、构建一个多任务网络分别做:BBox Regression、Classification、Object Mask、VP Prediction等;
5、使用现有数据集做模型Transfer Learning(fine tune);
6、使用FCN、FPN、Quantization之类的方法改进网络效果或做加速,裁剪模型降低模型大小;
7、使用scale权衡速度与精度;
8、使用类似RNN或LSTM融合上下文信息。
不管哪种方法,对于硬件和工程的要求越来越高,因为你要保证inference的时间是实时的。当硬件条件不佳时(车联网领域用的较多的MTK8665芯片,采用ARM架构、MALI GPU)就得在工程上做很多优化的事情,例如图片的预处理、矩阵乘法之类的需要在ARM架构下利用寄存器做优化。如果你很有钱,用高端的Nvidia芯片,那这方面麻烦会小些,但你的产品性价比可能下降。
13.2.3 Vanishing Point Guided Network
这是去年10月份提出的一个基于深度学习的方法,应该是目前为止实测效果最好的之一,亮点有:多种气候环境下的标注数据集;一个带VP预测的多任务网络。
数据集
车道线数据相比其他检测、分类数据最大的不同是标注数据比较窄(车道线)且不容易标注类似的Bounding Box,而且这种标注会有以下问题:
1)、特征提取阶段由于convolution和pooling操作会导致信息损失甚至消失;
2)、由于一般网络输入会有resize操作,所以车道线的标注信息有可能因为图片太小而看不到。
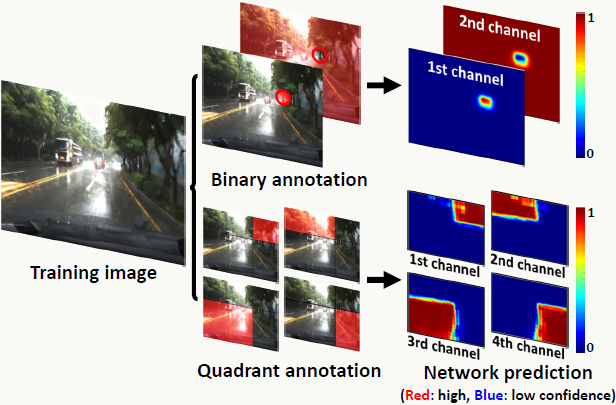
所以为了解决以上问题,对车道线标注采用grid-level网格级标注,示例如下:
![]()
如果网格中的任意一个像素位于某类车道线的标注线内,则整个网格都会被标记为该类。假设网络输入为640×480,输出为80×60,缩放系数为1/8,所以启发式的可以将网格大小设置为8×8(不一定非得这么设置)。 除车道线外,还需要标注VP(消失点),当然VP的标注是纯人工标注,为道路所有车道线在远端的交叉点。注意,不管道路是直的还是弯的都会有VP。
整体网络结构
整个网络是一个multi-task网络,可完成对车道线、路上交通标志、以及消失点的检测和识别,共享特征提取部分,有4个分支网络:预测VP的网络(VPP)、多分类网络(Multi-label)、bbox回归网络(Grid Box)、目标检测网络(Object Mask),结构描述如下:
![]()
需要注意,bbox回归对有固定形状的物体可以做一个box来框柱物体,但对车道线没法用一个box框定,所以文中做了一个车道线检测回归的创新:对网格里的像素,回归到与其最近的网格单元(网格粒度的regression),这样对普通物体、道路上的交通标志、车道线在检测回归上得到框架上的统一。在后处理阶段,普通物体分类只需要使用多分类网络的结果,道路上的交通标志、车道线结合bbox回归和多分类网络的结果就可知道。 整个网络的损失函数描述如下: \[Loss=w_1L_{reg}+w_2L_{om}+w_3L_{ml}+w_4L_{vp}\] 其中\(L_{reg}\)是一个grid regression L1损失,\(L_{om}、L_{ml}、L_{vp}\)是交叉熵损失。
消失点预测
消失点(Vanishing Point)在复杂环境下对车道线的检测等应用有较好的辅助作用,它其实是提供了相对全局的地理信息,举个例子:当行驶在没有车道线的乡间小路上,根据VP的位置可以做车道线绘制;下雨天,根据消失点可以做车道线预测。 在确定VPP损失函数上,文章做了几种尝试:
- 使用回归损失函数:由于和其他任务的损失函数在尺度上不一致,所以很难去平衡整体函数损失;
- 使用二分类交叉熵损失函数:交叉熵本质上衡量的是实际数据的概率分布与我们假设模型的概率分布是否一致,交叉熵损失可以平衡不同任务的梯度传播(思考一个问题:平常我们经常会出于对数值平滑、控制值域范围、概率的乘法转加法等目的对数值做log运算,那么从熵的角度如何考虑这个变换的意义?)。最简单处理VP的方式是,用一个圈把VP圈出来,然后对所有像素做二分类:处于圈内还是圈外,由于天然的样本不平衡,圈外的样本远多于圈内,所以模型的稳定性和收敛性都比较差,比如所有像素倾向于全部分配到圈外。
- 使用多分类交叉熵:交叉熵的好处同上,我认为文章最大的亮点在于提出用象限去识别VP,即:以VP为中心,把图片划分为四个象限,反过来,四个象限的交叉点即为VP;VPP这个模型的通道有5个:默认通道(代表不是VP),象限1、象限2、象限3、象限4;每个像素都会出现在这5个通道中的1个,对于VP中的任何一个像素会被分配到某个象限通道且不会出现在默认通道中,当VP信息较弱时,所有像素趋向于被分配到默认通道,此时默认通道的平均置信度会比较高。
![]()
观察任务特点:VPP任务的和车道线检测任务有潜在相关性(车道线在远处的交汇点即为VP),所以如果两个任务同时进行会互相影响,因此,训练过程需要分为两个阶段:
第一阶段仅训练VPP网络:除了VPP外,其他网络的学习率设置为0,虽然如此,可以观察到VPP训练结束后,其他网络的损失函数值会下降20%左右,因为大家共用同一套特征提取网络,也侧面印证了前面说的VPP和其他任务的先验相关性。
第二阶段所有网络同时训练:通过\(w_1\)~\(w_4\)控制不同损失的权重,权重初始值为1,当初始损失函数值出现后,这些权重值会被设置为这些损失函数值的倒数,在训练的任何阶段,如果发现损失函数值之间的尺度差异过大,则利用上面方法调整;网络不断学习,直到其在验证集上的精度收敛。
图像后处理
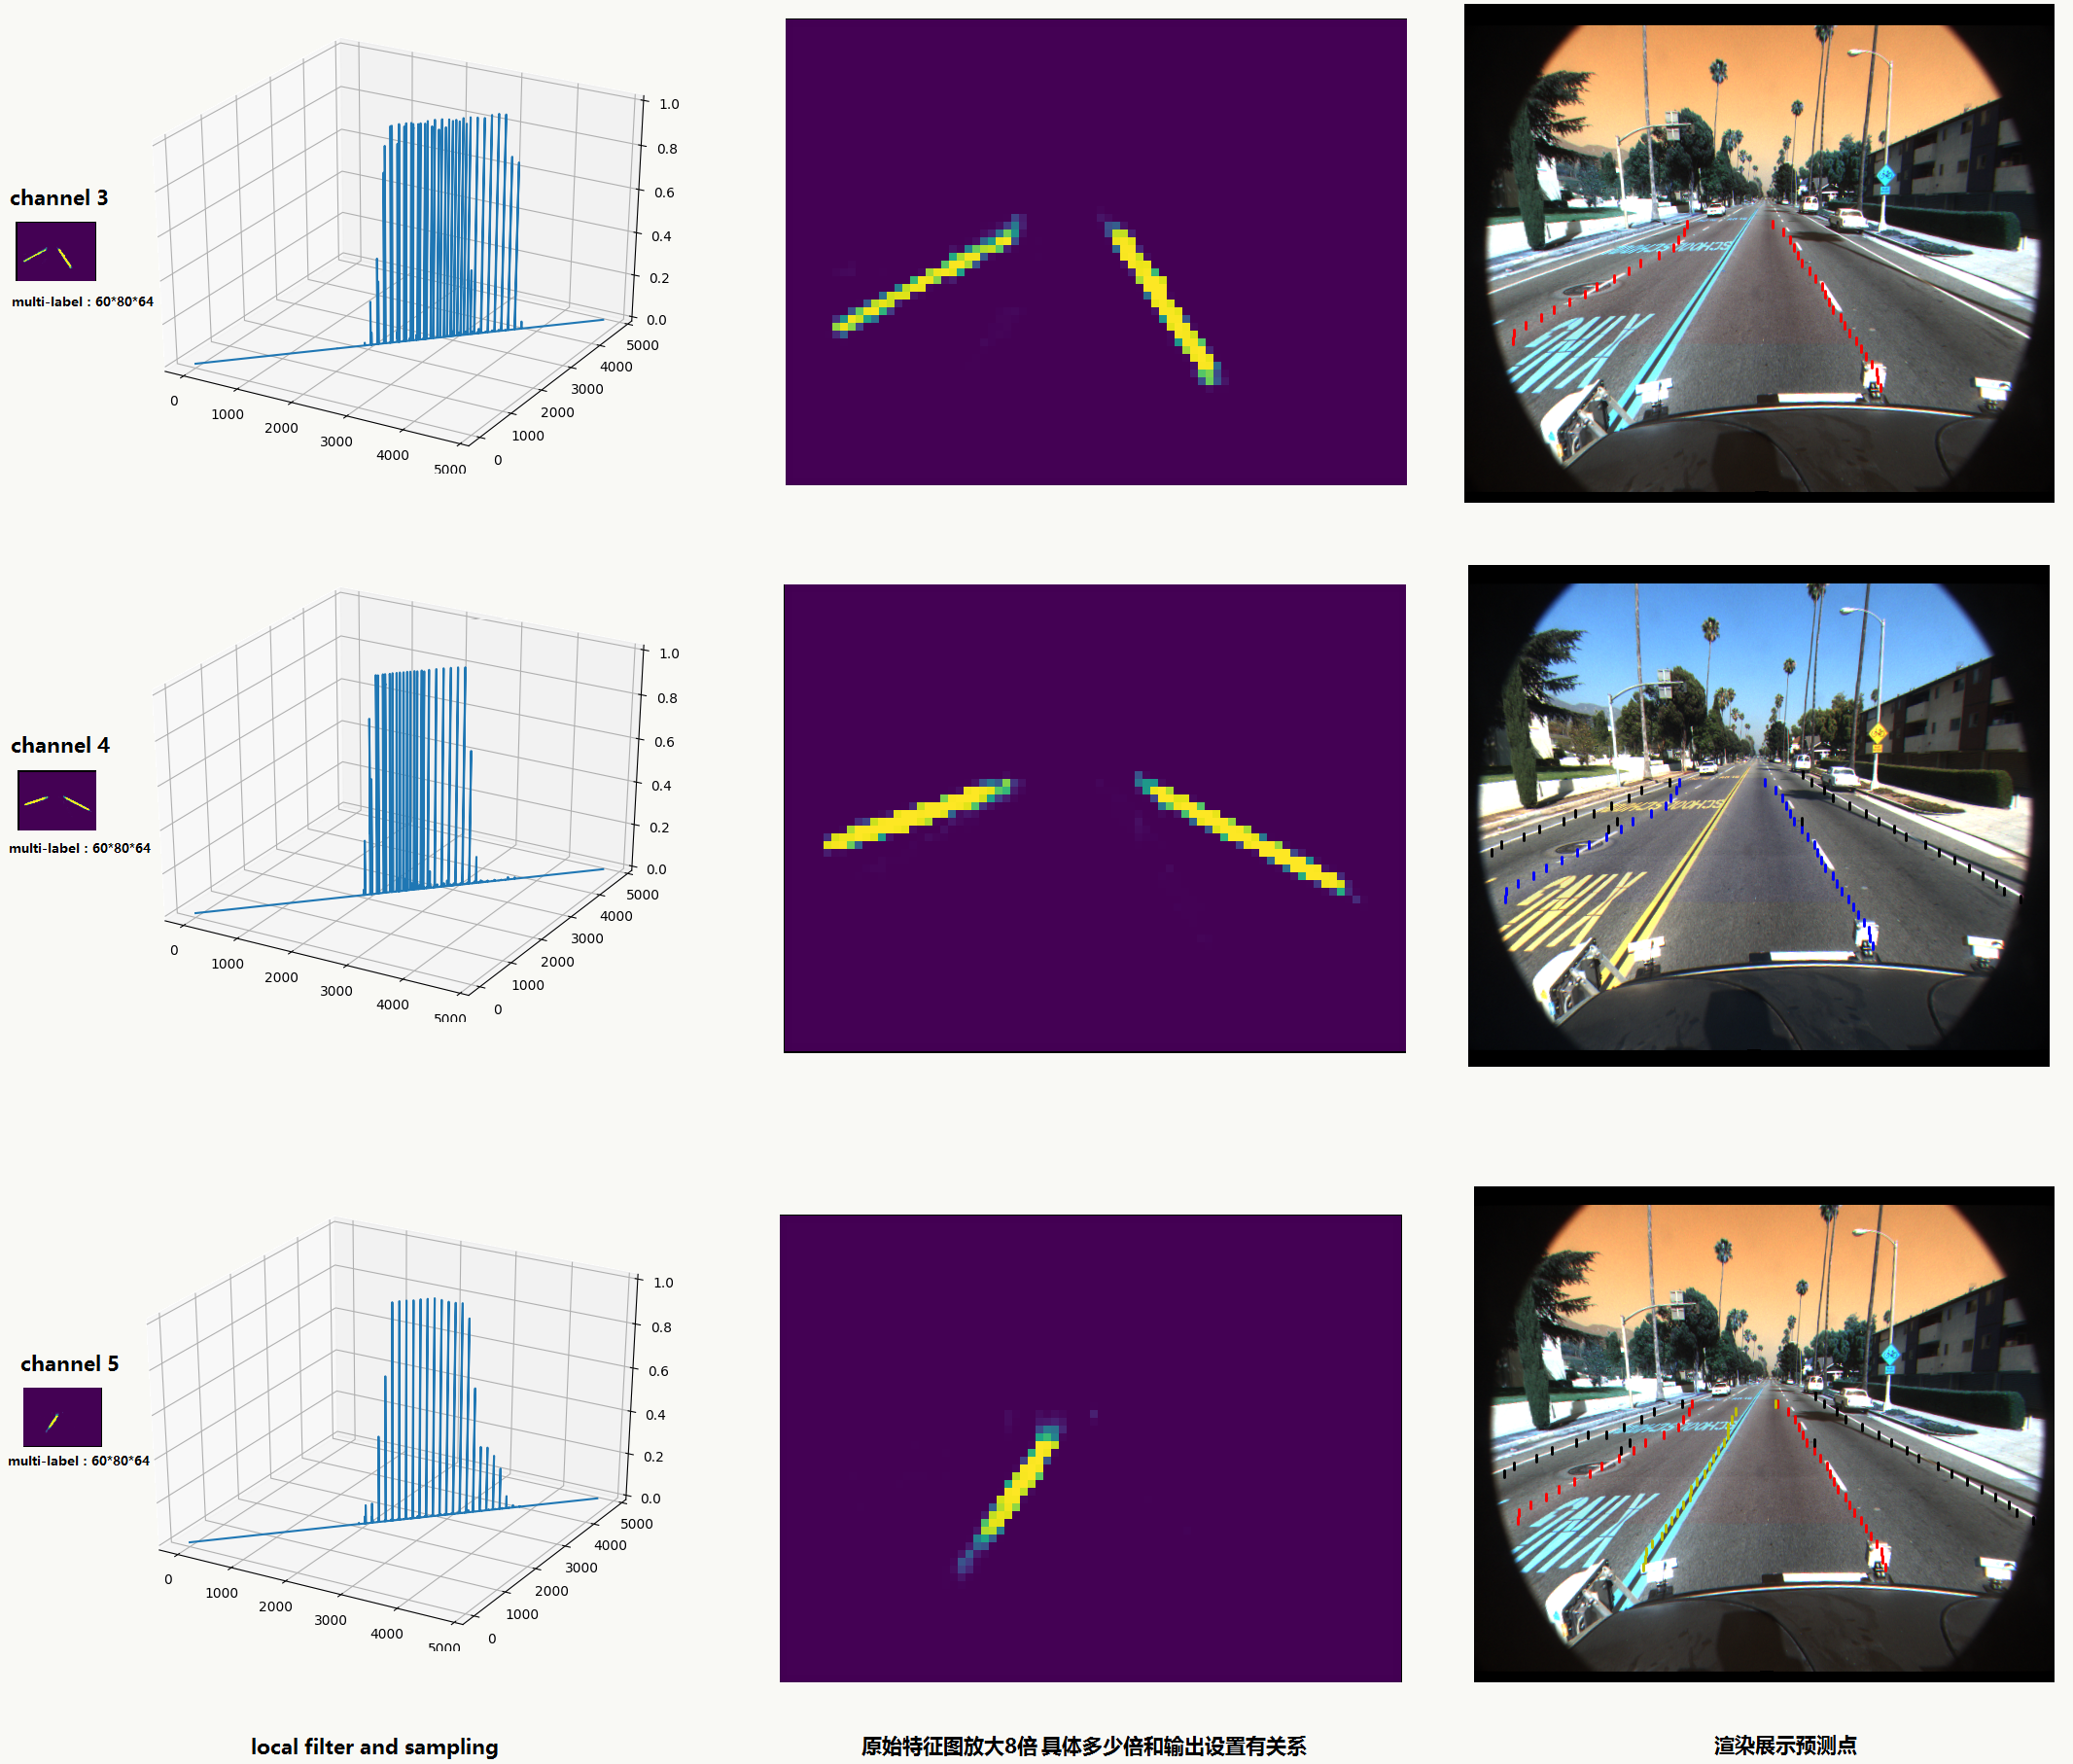
车道线:首先,在多分类网络的车道线通道抽样局部最优值,这些值对应的点是潜在的车道线分割点;其次,通过逆透视变换(IPM)生成鸟瞰图,并把上述点映射到鸟瞰图;再次,应用基于密度的聚类算法(如:DBSCAN)对上述点做聚类,注:这里有个技巧,根据纵坐标对像素点做概率降序排列,然后做分桶操作,通过这个方法降低聚类时间复杂度;最后,利用上述方法生成VP。
路面交通标志:首先,从多分类网络输出中对每个类以高置信度从网格回归任务中提取网格单元格;然后,我们选择每个网格的角点并将它们与附近的网格单元迭代合并;如果没有更多的相邻网格单元属于同一类,则合并终止。某些道路标记(如人行横道或安全区域)很难通过单个框定义,因此会通过网格采样进行定位。
代码示例 由于三星没有公开数据集,所以只能用Caltech Lanes Dataset数据集做测试。
生成训练数据和测试数据标注(根据原始的点标注生成网格级标注),需要安装MATLAB,代码如下:
1
2
3
4
5
6
7
8
9
10
11
12
13
14
15
16
17
18
19
20
21
22
23
24
25
26
27
28
29
30
31
32
33
34
35
36
37
38
39
40
41
42
43
44
45
46
47
48
49
50
51
52
53
54
55
56
57
58
59
60
61
62
63
64
65
66clear all;
close all; clc;
category = 'cordova1';
addpath(genpath('./caltech-lane-detection/matlab'))
path = './';
file = sprintf('/%s/labels.ccvl', category);
gLabelData = ccvLabel('read', [path file]);
h = 0.02;
height = 480;
width = 640;
gg = 8;
grid_x = 1:gg:481;
grid_y = 1:gg:641;
thickness = 2;
fileID = fopen(sprintf('./%s.txt', category),'w');
numFrames = size(gLabelData.frames,2);
gLabelSubtypes = {'bw', 'sw', 'dy', 'by', 'sy'};
for i = 1:numFrames
disp(sprintf('frame: %03d',i))
numLanes = size(gLabelData.frames(i).labels, 2);
segs = [];
splines = {numLanes};
sptypes = {numLanes};
for j = 1:numLanes
splines{j} = ccvEvalBezSpline(gLabelData.frames(i).labels(j).points, h); % convert 4 point to spline
sptypes{j} = gLabelData.frames(i).labels(j).subtype;
splines_x1 = splines{j};
splines_x2 = splines{j};
splines_x1(:,1) = splines_x1(:,1) - thickness;
splines_x2(:,1) = splines_x2(:,1) + thickness;
splines{j} = [splines{j}; splines_x1; splines_x2];
for k = 1:size(splines{j},1) % make spline points into bounding box
grid_pos_x = floor((splines{j}(k,1)-1)/gg);
grid_pos_y = floor((splines{j}(k,2)-1)/gg);
xmin = grid_pos_x * gg + 1;
xmax = grid_pos_x * gg + gg;
ymin = grid_pos_y * gg + 1;
ymax = grid_pos_y * gg + gg;
grid_width = xmax - xmin;
grid_height = ymax - ymin;
inst_id = j;
lane_id = find(ismember(gLabelSubtypes, sptypes{j}));
segs = [segs; xmin, ymin, xmax, ymax, inst_id, lane_id];
end
segs = unique(segs, 'rows');
end
numLaneSegs = size(segs, 1) - numLanes;
fprintf(fileID,'/%s/f%05d.png %d',category, i-1, size(segs,1));
for j = 1:size(segs,1)
xmin = segs(j,1);
ymin = segs(j,2);
xmax = segs(j,3);
ymax = segs(j,4);
inst_id = segs(j,5);
lane_id = segs(j,6);
fprintf(fileID, ' ');
fprintf( fileID, ' %d', xmin );
fprintf( fileID, ' %d', ymin );
fprintf( fileID, ' %d', xmax );
fprintf( fileID, ' %d', ymax );
fprintf( fileID, ' %d', lane_id ); % depth data -> lane_id
end
fprintf(fileID,'\n');
end
fclose('all');生成lmdb格式的训练和测试数据,代码:
1
2
3
4
5
6
7
8
9
10Declare $PATH_TO_DATASET_DIR and $PATH_TO_DATASET_LIST
PATH_TO_DATASET_DIR=/data1/workspace/liyiran/VPGNet/caltech-lanes-dataset
PATH_TO_DATASET_LIST=/data1/workspace/liyiran/VPGNet/caltech-lanes-dataset/dataset/all.txt
../../build/tools/convert_driving_data $PATH_TO_DATASET_DIR $PATH_TO_DATASET_LIST LMDB_train
../../build/tools/compute_driving_mean LMDB_train ./driving_mean_train.binaryproto lmdb
PATH_TO_DATASET_LIST=/data1/workspace/liyiran/VPGNet/caltech-lanes-dataset/dataset/test.txt
../../build/tools/convert_driving_data $PATH_TO_DATASET_DIR $PATH_TO_DATASET_LIST LMDB_test训练模型:
- solver.prototxt
1
2
3
4
5
6
7
8
9
10
11
12
13
14
15
16
17net: "./train_val.prototxt"
test_iter: 20
test_interval: 100
test_compute_loss: true
base_lr: 0.005
lr_policy: "step"
gamma: 0.1
stepsize: 100000
display: 10
max_iter: 100000
momentum: 0.9
weight_decay: 0.0005
snapshot: 2500
snapshot_prefix: "./snapshots/split"
solver_mode: GPU - train.sh
1
../../build/tools/caffe train --solver=./solver.prototxt -weights ./snapshots/split_iter_100000.caffemodel -gpu all >> ./output/output.log 2>&1
- pre-trained model,大概446M,传不上去,有需要单找我吧。
- solver.prototxt
后处理及模型inference
- caffe_inference.cpp,inference的c++版本,需要安装配置好caffe:
1
2
3
4
5
6
7
8
9
10
11
12
13
14
15
16
17
18
19
20
21
22
23
24
25
26
27
28
29
30
31
32
33
34
35
36
37
38
39
40
41
42
43
44
45
46
47
48
49
50
51
52
53
54
55
56
57
58
59
60
61
62
63
64
65
66
67
68
69
70
71
72
73
74
75
76
77
78
79
80
81
82
83
84
85
86
87
88
89
90
91
92
93
94
95
96
97
98
99
100
101
102
103
104
105
106
107
108
109
110
111
112
113
114
115
116
117
118
119
120
121
122
123
124
125
126
127
128
129
130
131
132
133
134
135
136
137
138
139
140
141
142
143
144
145
146
147
148
149
150
151
152
153
154
155
156
157
158
159
160
161
162
163
164
165
166
167
168
169
170
171
172
173
174
175
176
177
178
179
180
181
182
183
184
185
186
187
188
189
190
191
192
193
194
195
196
197
198
199
200
201
202
203
204
205
206
207
208
209
210
211
212
213
214
215
216
217
218
219
220
221
222
223
224
225
226
227
228
229
230
231
232
233
234
235
236
237
238
239
240
241
242
243
244
245
246
247
248
249
250
251
252
253
using namespace caffe;
using namespace cv;
std::string caffe_root = "/data1/workspace/liyiran/VPGNet/caffe/models/vpgnet-novp/inference/";
//dump caffe feature map
class CaffeDump {
public:
CaffeDump(const std::string& net_file, const std::string& weight_file, const int GPUID);
~CaffeDump();
void caffe_forward(cv::Mat, const std::string& , int, const std::string&, int);
private:
void preprocess(const cv::Mat cv_image);
cv::Mat image_translation(cv::Mat & srcImage, int x0ffset, int y0ffset);
private:
shared_ptr<Net<float> > net_;
int num_channels_;
float threshold_;
};
CaffeDump::CaffeDump(const std::string& net_file, const std::string& weights_file, const int GPUID)
{
Caffe::SetDevice(GPUID);
Caffe::set_mode(Caffe::GPU);
net_.reset(new Net<float>(net_file, caffe::TEST));
net_->CopyTrainedLayersFrom(weights_file);
Blob<float>* input_layer = net_->input_blobs()[0];
num_channels_ = input_layer->channels();
CHECK_EQ(num_channels_, 3) << "Input layer should have 3 channels.";
}
CaffeDump::~CaffeDump() {}
void CaffeDump::caffe_forward(cv::Mat cv_image, const std::string& layer_name, int channel, const std::string& filepath, int factor)
{
if (cv_image.empty()) {
std::cout << "Can not reach the image" << std::endl;
return;
}
preprocess(cv_image);
net_->ForwardFrom(0);
shared_ptr<caffe::Blob<float>> layerData =net_->blob_by_name(layer_name);
int batch_size = layerData->num();
int dim_features = layerData->count() / batch_size;
int channels = layerData->channels();
int height = layerData->height();
int width = layerData->width();
std::cout << "batch size:" << batch_size << std::endl;
std::cout << "dimension:" << dim_features << std::endl;
std::cout << "channels:" << channels << std::endl;
std::cout << "height:" << height << std::endl;
std::cout << "width:" << width << std::endl;
std::cout << "channels*height*width:" << channels*height*width << std::endl;
CHECK_LT(channel, channels) << "Input channel number should small than channels.";
float* feature_blob_data;
for (int n = 0; n < batch_size; ++n)
{
feature_blob_data = layerData->mutable_cpu_data() +
layerData->offset(n);
float *arr = (float(*))malloc(height*width*sizeof(float));
int idx = 0;
for (int d = 0; d < dim_features; ++d)
{
if (idx < height*width){
arr[idx] = feature_blob_data[idx+channel*height*width];
idx++;
}
}
int len = height*width;
float min_val = *std::min_element (arr,arr+len);
float max_val = *std::max_element(arr,arr+len);
std::cout << "size of feature:" << idx << ",max "
<< *std::max_element(arr,arr+len) << ",min " <<*std::min_element (arr,arr+len)<<std::endl;
for (int i=0;i<len;i++){
arr[i] = 255*(arr[i]-min_val)/(max_val-min_val);
}
const cv::Mat img(cv::Size(width, height), CV_32FC1, arr);
cv::imwrite(filepath+".jpg", img);
const cv::Mat scale_img(cv::Size(width*factor, height*factor), CV_32FC1, arr);
cv::imwrite(filepath+"_"+std::to_string(factor)+"x.jpg", scale_img);
cv::Mat srcImage=cv::imread(filepath+"_"+std::to_string(factor)+"x.jpg");
int x0ffset = -180;
int y0ffset = -180;
//图像左平移不改变大小
cv::Mat resultImage1 = image_translation(srcImage, x0ffset, y0ffset);
cv::imwrite(filepath+"_"+std::to_string(factor)+"x-off.jpg", resultImage1);
std::cout << ("\n");
} // for (int n = 0; n < batch_size; ++n)
}
cv::Mat CaffeDump::image_translation(cv::Mat & srcImage, int x0ffset, int y0ffset)
{
int nRows = srcImage.rows;
int nCols = srcImage.cols;
cv::Mat resultImage(srcImage.size(), srcImage.type());
//int nRows = srcImage.rows + abs(y0ffset);
//int nCols = srcImage.cols + abs(x0ffset);
//cv::Mat resultImage(nRows, nCols, srcImage.type());
//遍历图像
for (int i = 0; i < nRows; i++)
{
for (int j = 0; j < nCols; j++)
{
//映射变换
int x = j - x0ffset;
int y = i - y0ffset;
//边界判断
if (x >= 0 && y >= 0 && x < nCols && y < nRows)
{
resultImage.at<cv::Vec3b>(i, j) = srcImage.ptr<cv::Vec3b>(y)[x];
}
}
}
return resultImage;
}
void CaffeDump::preprocess(const cv::Mat cv_image) {
cv::Mat cv_new(cv_image.rows, cv_image.cols, CV_32FC3, cv::Scalar(0, 0, 0));
int height = cv_image.rows;
int width = cv_image.cols;
/* Mean normalization (in this case it may not be the average of the training) */
for (int h = 0; h < height; ++h) {
for (int w = 0; w < width; ++w) {
cv_new.at<cv::Vec3f>(cv::Point(w, h))[0] = float(cv_image.at<cv::Vec3b>(cv::Point(w, h))[0]);// - float(102.9801);
cv_new.at<cv::Vec3f>(cv::Point(w, h))[1] = float(cv_image.at<cv::Vec3b>(cv::Point(w, h))[1]);// - float(115.9465);
cv_new.at<cv::Vec3f>(cv::Point(w, h))[2] = float(cv_image.at<cv::Vec3b>(cv::Point(w, h))[2]) ;//- float(122.7717);
}
}
/* Max image size comparation to know if resize is needed */
int max_side = MAX(height, width);
int min_side = MIN(height, width);
float max_side_scale = float(max_side) / MAX_INPUT_SIDE;
float min_side_scale = float(min_side) / MIN_INPUT_SIDE;
float max_scale = MAX(max_side_scale, min_side_scale);
float img_scale = 1;
if (max_scale > 1)
img_scale = float(1) / max_scale;
int height_resized = int(height * img_scale);
int width_resized = int(width * img_scale);
cv::Mat cv_resized;
cv::resize(cv_new, cv_resized, cv::Size(width_resized, height_resized));
float data_buf[height_resized*width_resized * 3];
for (int h = 0; h < height_resized; ++h)
{
for (int w = 0; w < width_resized; ++w)
{
data_buf[(0 * height_resized + h)*width_resized + w] = float(cv_resized.at<cv::Vec3f>(cv::Point(w, h))[0]);
data_buf[(1 * height_resized + h)*width_resized + w] = float(cv_resized.at<cv::Vec3f>(cv::Point(w, h))[1]);
data_buf[(2 * height_resized + h)*width_resized + w] = float(cv_resized.at<cv::Vec3f>(cv::Point(w, h))[2]);
}
}
net_->blob_by_name("data")->Reshape(1, num_channels_, height_resized, width_resized);
Blob<float> * input_blobs = net_->input_blobs()[0];
switch (Caffe::mode()) {
case Caffe::CPU:
memcpy(input_blobs->mutable_cpu_data(), data_buf, sizeof(float) * input_blobs->count());
break;
case Caffe::GPU:
caffe_gpu_memcpy(sizeof(float)* input_blobs->count(), data_buf, input_blobs->mutable_gpu_data());
break;
default:
LOG(FATAL) << "Unknow Caffe mode";
}
}
int main(int argc, char * argv[])
{
if (argc < 2)
{
printf("Usage caffe_test <net.prototxt> <net.caffemodel> <inputFile_txt> <outputDirectory> <output_prefix>\n");
return -1;
}
int GPUID = 0;
std::string prototxt_file = argv[1];
std::string caffemodel_file = argv[2];
const char * input_files_path = argv[3];
const char * output_directory = argv[4];
std::cout << "Reading the given prototxt file : " << prototxt_file << std::endl;
std::cout << "Reading the given caffemodel file: " << caffemodel_file << std::endl;
FILE * fs;
char * image_path = NULL;
size_t buff_size = 0;
ssize_t read;
fs = fopen(input_files_path, "r");
if (!fs) {
std::cout << "Unable to open the file." << input_files_path << std::endl;
return -1;
}
CaffeDump dump(prototxt_file.c_str(), caffemodel_file.c_str(), GPUID);
cv::Mat image = cv::imread(input_files_path, CV_LOAD_IMAGE_COLOR);
std::cout << input_files_path << std::endl;
//dump.caffe_forward(image, "bb-output-tiled", 0);
for (int i=0; i<5; i++){
dump.caffe_forward(image, "multi-label", i, "./l"+std::to_string(i), 8);}
dump.caffe_forward(image, "data" ,2, "./org", 1);
//dump.caffe_forward(image, "type-conv-tiled" ,0);
BlobProto blob_proto;
string mean_file = "/data1/workspace/liyiran/VPGNet/caffe/models/vpgnet-novp/driving_mean_train.binaryproto";
ReadProtoFromBinaryFileOrDie(mean_file, &blob_proto);
Blob<float> data_mean_;
data_mean_.FromProto(blob_proto);
std::cout << "mean file:" << data_mean_.num() << std::endl;
std::cout << data_mean_.channels() << std::endl;
std::cout << data_mean_.height() << std::endl;
std::cout << data_mean_.width() << std::endl;
return 0;
} - make.sh,具体路径根据实际机器情况自行配置:
1
2export LD_LIBRARY_PATH=/usr/local/boost/lib:/usr/local/cuda/lib64:/usr/local/lib
g++ -std=c++11 caffe_inference.cpp `pkg-config --libs opencv` -I /data1/workspace/liyiran/VPGNet/caffe/build/ -I /data1/workspace/liyiran/VPGNet/caffe/build/src/ -L /data1/workspace/liyiran/VPGNet/caffe/build/lib/ -o caffe_inference -lboost_system -lcaffe -lglog -g
- caffe_inference.cpp,inference的c++版本,需要安装配置好caffe:
python版inference及后处理
deploy.prototxt
py_inference.py:
1
2
3
4
5
6
7
8
9
10
11
12
13
14
15
16
17
18
19
20
21
22
23
24
25
26
27
28
29
30
31
32
33
34
35
36
37
38
39
40
41
42
43
44
45
46
47
48
49
50
51
52
53
54
55
56
57
58
59
60
61
62
63
64
65
66
67
68
69
70
71
72
73
74
75
76
77
78
79
80
81
82
83
84
85
86
87
88
89
90
91
92
93
94
95
96
97
98
99
100
101
102
103
104
105
106
107
108
109
110
111
112
113
114
115
116
117
118
119
120
121
122
123
124
125
126
127
128
129
130
131
132
133
134
135
136
137
138
139
140
141
142
143
144
145
146
147
148
149
150
151
152
153
154
155
156
157
158
159
160
161
162
163
164
165
166
167
168
169
170
171
172
173
174
175
176
177
178
179
180
181
182
183
184
185
186
187
188
189
190
191
192
193
194
195
196
197
198
199
200
201
202
203
204
205
206
207
208
209
210
211
212
213
214
215
216
217
218
219
220
221
222
223
224
225
226
227
228
229
230
231
232
233
234
235
236
237
238
239
240
241
242
243
244
245
246
247
248
249
250
251
252
253
254
255
256
257
258
259
260
261
262
263
264
265
266
267
268
269
270
271
272
273
274
275
276
277
278
279
280
281
282
283
284
285
286
287
288
289
290
291
292
293
294
295
296# -*- coding: UTF-8 -*-
import matplotlib
matplotlib.use('Agg')
import numpy as np
from numpy import NaN, Inf, arange, isscalar, asarray, array
import matplotlib.pyplot as plt
from mpl_toolkits.mplot3d import Axes3D
import os
import sys
import pickle
import cv2
import scipy.signal as signal
import matplotlib.pyplot as plt
import heapq
from compiler.ast import flatten
caffe_root = '/data1/workspace/liyiran/VPGNet/caffe/'
deployPrototxt = '../deploy.prototxt'
modelFile = '../snapshots/split_iter_100000.caffemodel'
meanFile = '/models/vpgnet-novp/driving_mean_train.binaryproto'
imageListFile = './image_list.txt'
resultFile = 'PredictResult.txt'
sys.path.insert(0, caffe_root + 'python')
import caffe
colors = {1:'r', 2:'b', 3:'g', 4:'k', 5:'y'}
#网络初始化
def initilize():
print 'initilize ... '
caffe.set_mode_gpu()
caffe.set_device(0)
net = caffe.Net(deployPrototxt, modelFile,caffe.TEST)
return net
def convert_mean(binMean,npyMean):
blob = caffe.proto.caffe_pb2.BlobProto()
bin_mean = open(binMean, 'rb' ).read()
blob.ParseFromString(bin_mean)
arr = np.array( caffe.io.blobproto_to_array(blob) )
npy_mean = arr[0]
np.save(npyMean, npy_mean )
#取出网络中的params和net.blobs的中的数据
def inference(image, net):
# input preprocessing: 'data' is the name of the input blob == net.inputs[0]
transformer = caffe.io.Transformer({'data': net.blobs['data'].data.shape})
transformer.set_transpose('data', (2,0,1))
binMean=caffe_root + meanFile
npyMean=caffe_root+'/models/vpgnet-novp/driving_mean_train.npy'
convert_mean(binMean,npyMean)
transformer.set_mean('data', np.load(npyMean).mean(1).mean(1)) # mean pixel
transformer.set_raw_scale('data', 255)
# the reference model operates on images in [0,255] range instead of [0,1]
transformer.set_channel_swap('data', (2,1,0))
# the reference model has channels in BGR order instead of RGB
net.blobs['data'].data[...] = transformer.preprocess('data', caffe.io.load_image(image))
out = net.forward()
print '# blob info of net...'
print '\n'.join(str(k)+":"+str(v) for k,v in [(k, v.data.shape) for k, v in net.blobs.items()])
print '# param info of net...'
print '\n'.join(str(k)+":"+str(v) for k,v in [(k, v[0].data.shape) for k, v in net.params.items()])
#网络提取L6c的卷积核
#filters = net.params['L6c'][0].data
#with open('FirstLayerFilter.pickle','wb') as f:
# pickle.dump(filters,f)
#vis_square(filters.transpose(0, 2, 3, 1))
return net
def extract_features(net,layer_name,channels,fname,single_layer=0,factor=8):
if not net.blobs.has_key(layer_name):
print "layer's name is not exist."
return
if channels < 1:
fea = net.blobs[layer_name].data[0]
elif single_layer == 0:
fea = net.blobs[layer_name].data[0][0:channels]
else:
fea = net.blobs[layer_name].data[0][channels-1:channels]
#multi_label_shifted = fea
multi_label_shifted = np.zeros(fea.shape)
multi_label_shifted[:,1:,1:] = fea[:,:-1,:-1]
vis_and_resize(multi_label_shifted,0,0,factor,fname)
if channels >= 1:
prob_histogram(multi_label_shifted,fname)
def vis_and_resize(data, padsize=1, padval=0, factor=8, fname='heatmap.jpg'):
data -= data.min()
data /= data.max()
#让合成图为方
n = int(np.ceil(np.sqrt(data.shape[0])))
padding = ((0, n ** 2 - data.shape[0]), (0, padsize), (0, padsize)) + ((0, 0),) * (data.ndim - 3)
data = np.pad(data, padding, mode='constant', constant_values=(padval, padval))
#合并卷积图到一个图像中
data = data.reshape((n, n) + data.shape[1:]).transpose((0, 2, 1, 3) + tuple(range(4, data.ndim + 1)))
data = data.reshape((n * data.shape[1], n * data.shape[3]) + data.shape[4:])
plt.figure(figsize=(data.shape[1], data.shape[0]),dpi=1)
plt.subplots_adjust(top=1,bottom=0,left=0,right=1,hspace=0,wspace=0)
frame = plt.gca()
frame.axes.get_yaxis().set_visible(False)
frame.axes.get_xaxis().set_visible(False)
plt.imshow(data)
plt.savefig(fname)
plt.close(0)
img = cv2.imread(fname)
height, width = img.shape[:2]
img = cv2.resize(img, None, fx=factor, fy=factor, interpolation=cv2.INTER_AREA)
name = fname.split('.')
if len(name)==2:
cv2.imwrite(name[0]+"_8x."+name[1], img)
else:
cv2.imwrite(fname+"_8x.jpg", img)
def prob_histogram(prob,fname='heatmap_his.jpg'):
plt.figure(figsize=(30, 15))
plt.plot(prob.flat)
name = fname.split('.')
if len(name)==2:
plt.savefig(name[0]+"_his."+name[1])
else:
plt.savefig(fname+"_his.jpg")
plt.close(0)
fig = plt.figure()
ax = Axes3D(fig)
width = prob.shape[1] * prob.shape[2]
x_vals = list(range(0, width))
y_vals = list(range(0, width))
z_vals = []
for p1 in range(0,prob.shape[1]):
#print smapling_peaks(prob.tolist()[0][p1])
for p2 in range(0,prob.shape[2]):
z_vals.append(prob.tolist()[0][p1][p2])
ax.plot(x_vals, y_vals, z_vals)
if len(name)==2:
plt.savefig(name[0]+"_3d."+name[1])
else:
plt.savefig(fname+"_3d.jpg")
plt.close(0)
def peakdet(v, delta, x = None):
"""
Converted from MATLAB script at http://billauer.co.il/peakdet.html
Returns two arrays
function [maxtab, mintab]=peakdet(v, delta, x)
%PEAKDET Detect peaks in a vector
% [MAXTAB, MINTAB] = PEAKDET(V, DELTA) finds the local
% maxima and minima ("peaks") in the vector V.
% MAXTAB and MINTAB consists of two columns. Column 1
% contains indices in V, and column 2 the found values.
%
% With [MAXTAB, MINTAB] = PEAKDET(V, DELTA, X) the indices
% in MAXTAB and MINTAB are replaced with the corresponding
% X-values.
%
% A point is considered a maximum peak if it has the maximal
% value, and was preceded (to the left) by a value lower by
% DELTA.
% Eli Billauer, 3.4.05 (Explicitly not copyrighted).
% This function is released to the public domain; Any use is allowed.
"""
maxtab = []
mintab = []
if x is None:
x = arange(len(v))
v = asarray(v)
if len(v) != len(x):
sys.exit('Input vectors v and x must have same length')
if not isscalar(delta):
sys.exit('Input argument delta must be a scalar')
if delta <= 0:
sys.exit('Input argument delta must be positive')
mn, mx = Inf, -Inf
mnpos, mxpos = NaN, NaN
lookformax = True
for i in arange(len(v)):
this = v[i]
if this > mx:
mx = this
mxpos = x[i]
if this < mn:
mn = this
mnpos = x[i]
if lookformax:
if this < mx-delta:
maxtab.append((mxpos, mx))
mn = this
mnpos = x[i]
lookformax = False
else:
if this > mn+delta:
mintab.append((mnpos, mn))
mx = this
mxpos = x[i]
lookformax = True
return array(maxtab), array(mintab)
def smapling_peaks(series):
window = signal.general_gaussian(51, p=1, sig=5)
filtered = signal.fftconvolve(window, series)
filtered = (np.average(series) / np.average(filtered)) * filtered
filtered = np.roll(filtered, -25)
maxtab, mintab = peakdet(filtered,abs(min(filtered)))
#plot(filtered, color='red')
#plot(series, color='blue')
#scatter(array(maxtab)[:,0], array(maxtab)[:,1], color='blue')
return array(maxtab)[:,0]
def post_processing(oname, fname, clo, th=10):
if not colors.has_key(clo):
print 'color key error!'
return None
name = fname.split('.')
img2 = cv2.imread(name[0]+"_8x."+name[1],0)
height, width = img2.shape[:2]
x = []
y = []
min_val = min(flatten(img2.tolist()))
for i in range(height):
peaks = smapling_peaks(img2[i].tolist()).tolist()
for item in peaks[:]:
if abs(img2[i].tolist()[int(item)]-min_val)<=th:
peaks.remove(item)
y.extend([i]*len(peaks))
x.extend(peaks)
plt.figure(figsize=(width, height),dpi=1)
plt.subplots_adjust(top=1,bottom=0,left=0,right=1,hspace=0,wspace=0)
frame = plt.gca()
frame.axes.get_yaxis().set_visible(False)
frame.axes.get_xaxis().set_visible(False)
org = cv2.imread(oname)
plt.imshow(org)
plt.xticks([]), plt.yticks([])
plt.plot(x,y, marker='o', c=colors[clo],markersize=200)
plt.savefig(name[0]+"_post."+name[1])
plt.close(0)
return x, y, clo
if __name__ == "__main__":
net = initilize()
testimage = 'f00125.png'
newt = testimage.split('.')
layer_name = 'multi-label'
net = inference(testimage, net)
#extract_features(net,layer_name, channels=2,fname='data_2_'+testimage,single_layer=1,factor=8)
extract_features(net,layer_name, channels=3,fname='data_3_'+testimage,single_layer=1,factor=8)
extract_features(net,layer_name, channels=4,fname='data_4_'+testimage,single_layer=1,factor=8)
extract_features(net,layer_name, channels=5,fname='data_5_'+testimage,single_layer=1,factor=8)
#extract_features(net,layer_name, channels=6,fname='data_6_'+testimage,single_layer=1,factor=8)
#post_processing(testimage, 'data_2_'+testimage, 1)
x1,y1,z1 = post_processing(testimage, 'data_3_'+testimage, 1)
x2,y2,z2 = post_processing('data_3_'+newt[0]+'_post.'+newt[1], 'data_4_'+testimage, 4)
x3,y3,z3 = post_processing('data_4_'+newt[0]+'_post.'+newt[1], 'data_5_'+testimage, 5)
x = []
x.extend(x1)
x.extend(x2)
x.extend(x3)
y = []
y.extend(y1)
y.extend(y2)
y.extend(y3)
print x,',',y
data = np.c_[x,y]
for i in range(len(data)):
print '[',data[i][0],',',data[i][4],'],'
#post_processing('data_5_'+newt[0]+'_post.'+newt[1], 'data_6_'+testimage, 5)
不同通道后处理后演示如下:
![]()
References
如有遗漏请提醒我补充:
1、《Understanding the Bias-Variance Tradeoff》http://scott.fortmann-roe.com/docs/BiasVariance.html
2、《Boosting Algorithms as Gradient Descent in Function Space》http://citeseerx.ist.psu.edu/viewdoc/download?doi=10.1.1.51.6893&rep=rep1&type=pdf
3、《Optimal Action Extraction for Random Forests and Boosted Trees》http://www.cse.wustl.edu/~ychen/public/OAE.pdf
4、《Applying Neural Network Ensemble Concepts for Modelling Project Success》http://www.iaarc.org/publications/fulltext/Applying_Neural_Network_Ensemble_Concepts_for_Modelling_Project_Success.pdf
5、《Introduction to Boosted Trees》https://homes.cs.washington.edu/~tqchen/data/pdf/BoostedTree.pdf
6、《Machine Learning:Perceptrons》http://ml.informatik.uni-freiburg.de/_media/documents/teaching/ss09/ml/perceptrons.pdf
7、《An overview of gradient descent optimization algorithms》http://sebastianruder.com/optimizing-gradient-descent/
8、《Ad Click Prediction: a View from the Trenches》https://www.eecs.tufts.edu/~dsculley/papers/ad-click-prediction.pdf
9、《ADADELTA: AN ADAPTIVE LEARNING RATE METHOD》http://www.matthewzeiler.com/pubs/googleTR2012/googleTR2012.pdf
9、《Improving the Convergence of Back-Propagation Learning with Second Order Methods》http://yann.lecun.com/exdb/publis/pdf/becker-lecun-89.pdf
10、《ADAM: A METHOD FOR STOCHASTIC OPTIMIZATION》https://arxiv.org/pdf/1412.6980v8.pdf
11、《Adaptive Subgradient Methods for Online Learning and Stochastic Optimization》http://www.jmlr.org/papers/volume12/duchi11a/duchi11a.pdf
11、《Sparse Allreduce: Efficient Scalable Communication for Power-Law Data》https://arxiv.org/pdf/1312.3020.pdf
12、《Asynchronous Parallel Stochastic Gradient Descent》https://arxiv.org/pdf/1505.04956v5.pdf
13、《Large Scale Distributed Deep Networks》https://papers.nips.cc/paper/4687-large-scale-distributed-deep-networks.pdf
14、《Introduction to Optimization —— Second Order Optimization Methods》https://ipvs.informatik.uni-stuttgart.de/mlr/marc/teaching/13-Optimization/04-secondOrderOpt.pdf
15、《On the complexity of steepest descent, Newton’s and regularized Newton’s methods for nonconvex unconstrained optimization》http://www.maths.ed.ac.uk/ERGO/pubs/ERGO-09-013.pdf
16、《On Discriminative vs. Generative classifiers: A comparison of logistic regression and naive Bayes 》http://papers.nips.cc/paper/2020-on-discriminative-vs-generative-classifiers-a-comparison-of-logistic-regression-and-naive-bayes.pdf
17、《Parametric vs Nonparametric Models》http://mlss.tuebingen.mpg.de/2015/slides/ghahramani/gp-neural-nets15.pdf
18、《XGBoost: A Scalable Tree Boosting System》https://arxiv.org/abs/1603.02754
19、一个可视化CNN的网站 http://shixialiu.com/publications/cnnvis/demo/
20、《Computer vision: LeNet-5, AlexNet, VGG-19, GoogLeNet》http://euler.stat.yale.edu/~tba3/stat665/lectures/lec18/notebook18.html
21、François Chollet在Quora上的专题问答:https://www.quora.com/session/Fran%C3%A7ois-Chollet/1
22、《将Keras作为tensorflow的精简接口》https://keras-cn.readthedocs.io/en/latest/blog/keras_and_tensorflow/
23、《Upsampling and Image Segmentation with Tensorflow and TF-Slim》https://warmspringwinds.github.io/tensorflow/tf-slim/2016/11/22/upsampling-and-image-segmentation-with-tensorflow-and-tf-slim/
24、《DENSELY CONNECTED CONVOLUTIONAL NETWORKS》http://www.cs.cornell.edu/~gaohuang/papers/DenseNet-CVPR-Slides.pdf
25、https://github.com/vivounicorn/convnet-study

